About the Book


is Senior Member of Technical Staff in the Department of Statistics at AT&T Labs – Research specializing in visualization, exploratory model analysis and data mining. He received his Ph. D. in Statistics from the University of Augsburg in 2004. He joined AT&T Labs – Research in 2004. Simon has been working on visualization and analysis of large datasets and has developed among others interactive visualization software iPlots and Klimt.

is Senior Project Manager in the Analysis Center of the Business Intelligence Unit of Telefónica o2-Germany. His research and application areas are data visualization and data mining as well as exploratory data analysis. Martin has worked in industry and research in both Germany and the USA. He received his Ph. D. in Statistics from the University of Augsburg in 1996. Martin is author of the data analysis software Mondrian. He is co-author of the book "Graphics of Large Datasets".
About the Authors

Interactive Graphics for Data Analysis: Principles and Examples discusses exploratory data analysis (EDA) and how interactive graphical methods can help gain insights as well as generate new questions and hypotheses from datasets.
Fundamentals of Interactive Statistical Graphics
The first part of the book summarizes principles and methodology, demonstrating how the different graphical representations of variables of a dataset are effectively used in an interactive setting. The authors introduce the most important plots and their interactive controls. They also examine various types of data, relations between variables, and plot ensembles.
Case Studies Illustrate the Principles
The second section focuses on nine case studies. Each case study describes the background, lists the main goals of the analysis and the variables in the dataset, shows what further numerical procedures can add to the graphical analysis, and summarizes important findings. Wherever applicable, the authors also provide the numerical analysis for datasets found in Cox and Snell’s landmark book.
This full-color text shows that interactive graphical methods complement the traditional statistical toolbox to achieve more complete, easier to understand, and easier to interpret analyses.
Sample Chapters

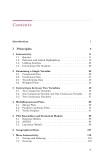
TOC
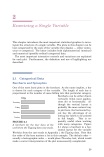
Chapter 2
Case Study A
Preface

Reviews

"…Interactive Graphics for Data Analysis gives you the ideas and tools to visualise, explore and understand all your data. …It … also introduces Mondrian, a powerful, easy-to-use tool that allows you to generate and explore everything shown. … If you have any data to present (or to mark), whether you are a psychologist, physicist, geographer, biologist or historian, whether writing a paper or dissertation, use this book. A brief, powerful book with excellent and clear graphics. … You have no excuse not to use it."
— Times Higher Education, December 2009
"…I was able to get an early copy [of the book] and was impressed enough with its content and format to make both the text and software topics for a series in Dashboard Insight. … Interactive Graphics articulates the approach of exploratory data analysis by emphasizing the fundamentals of interactive statistical graphics. …"
— Steve Miller (President, OpenBI), Dashboard Insight, February 2009
Errata

p. 19 second last paragraph: spinplots -> spineplots
p. 35 second last paragraph: bin with -> bin width
p. 89 !st sentence in Section 5.1: outputi -> output
p. 178 upper right: birth eight -> birth weight
