Slides

We set up a set up slides which go with the 9 chapters in the principles part. There are two sets of slides for each of the first 5 chapters and one set each for chapters 6-9. Thus we get 14 sets in total, which can cover roughly 14 weeks of a lecture and thus should take you through a semester.
There are only introductory slides for the case studies, as these should be worked through hands on in class or as homework. The slides are pdf-files and thus can be used on any system

Chapter 1: Interactivity

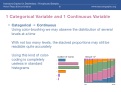
Chapter 2: Examining a Single Variable
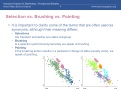
queries and selections
highlighting and color brushing

Chapter 3: Interactions between Two Variables
mosaic plots and spinograms
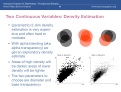
scatterplots, smoothers and 2-dim density estimators

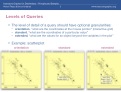
Chapter 4: Multidimensional Plots

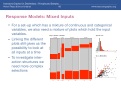
Chapter 5: Plot Ensembles and Statistical Models
response models and ANOVA
categorical models

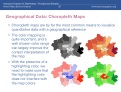
Chapter 6: Geographical Data

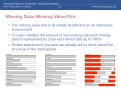
Chapter 8: Missing Values

Appendix i: Introduction to Mondrian

Case Studies
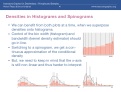
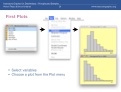
from barcharts to histograms
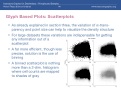
from density estimators to weighted plots
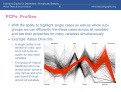
high dim mosaic plots and parallel coordinate plots
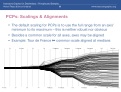
variable orderings in high dim plots and trellis displays
Chapter 7: More Interactivity
Chapter 9: Large Data
hands on case study


A – How to Pass an Exam
B – Washing – What Makes the Difference
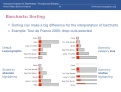
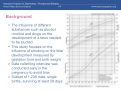
C – The Influence of Smoking on Birthweight
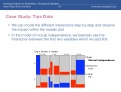
D – The Titanic Disaster Revisited
E – Housing Rent Prices in Munich
F – What Makes a Tour de France Winner
G – How to Survive the Thirty Years’ War
H – Classification of Italian Olive Oils
I – E-Voting in the 2004 Florida Election